1 Nov 2026
Enhancing European Match Predictions Through Climate and Performance Data Integration

Analysts across Europe's major leagues have started combining detailed climate records with player performance metrics to sharpen forecasts for upcoming fixtures, and this approach has gained traction as leagues push deeper into the 2026 calendar. Teams in the Bundesliga, Serie A and La Liga now draw on datasets that track temperature shifts, humidity levels and wind patterns alongside historical sprint distances, pass completion rates and recovery times, which allows forecasters to adjust expectations for specific venues and dates.
Climate Variables in Match Contexts
Weather agencies supply granular information that covers pitch conditions weeks in advance, and researchers at institutions such as the European Centre for Medium-Range Weather Forecasts supply models that factor in regional microclimates around stadiums in northern Germany or coastal Spain. When heavy rainfall coincides with cooler November evenings, for instance, data from the 2025-26 season shows reduced high-intensity runs among midfielders in matches played above 60 percent humidity, while defensive lines in similar conditions recorded fewer successful tackles per 90 minutes.
Performance Statistics as Baseline Inputs
Performance databases maintained by league partners compile individual and team metrics that include expected goals, progressive carries and aerial duel success, yet these numbers alone leave room for environmental adjustments. Analysts cross-reference these figures with venue-specific climate histories, which reveals patterns such as lower pass accuracy for visiting sides when temperatures drop below 8 degrees Celsius in eastern European grounds during late autumn fixtures. One study released by a consortium of sports science departments at universities in France and the Netherlands demonstrated that blending these layers improved forecast accuracy for goal totals by measurable margins across sampled matches from 2024 onward.
Integration Methods in Practice
Forecast teams apply machine learning frameworks that treat climate indicators as modifiers to core statistical models, and this process begins with ingestion of satellite-derived precipitation forecasts alongside real-time GPS data from training sessions. In practice, the system flags potential drops in endurance for players whose historical output declines under elevated wind speeds, then recalibrates projected lineups or substitution timings accordingly. Observers note that clubs preparing for Champions League group stage encounters in November 2026 have already incorporated these blended outputs when assessing travel impacts for squads moving between Mediterranean and Baltic climates.
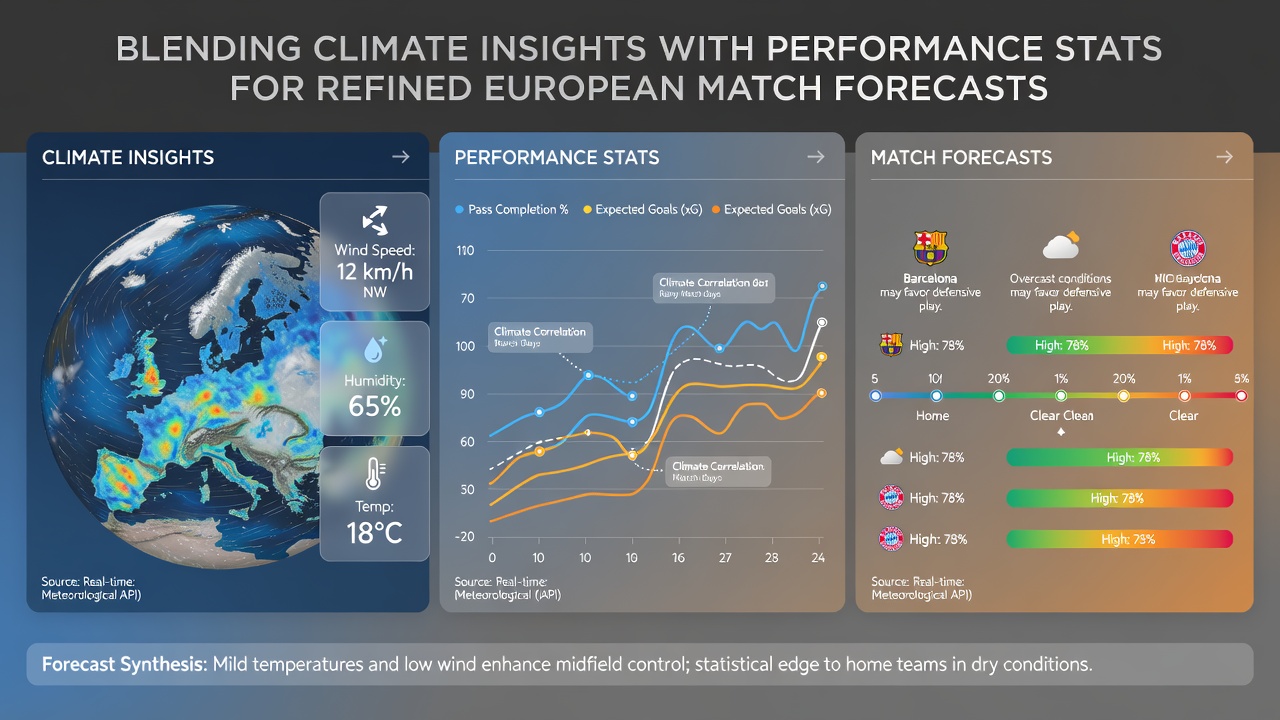
What's interesting is how the same methodology extends to set-piece situations, where wind direction data from national meteorological services combines with recorded delivery success rates to refine expected conversion probabilities. European leagues publish aggregate corner and free-kick statistics quarterly, yet forecasters now layer those numbers with localized atmospheric readings to account for crosswinds common at elevated stadiums in Switzerland or Austria.
Regional Data Sources and Applications
Government meteorological offices across the continent contribute open datasets that include hourly readings, and organizations such as the Australian Bureau of Meteorology have shared comparable frameworks used in other sports that European analysts have adapted for football contexts. Academic papers from Canadian research groups have examined similar integrations in ice hockey, offering transferable techniques for handling extreme cold that apply directly to winter fixtures in Scandinavia. Industry reports from bodies like the Sports Analytics Association further document how these combined inputs help refine pre-match expectations without relying solely on historical averages.
During the current 2026 season, several clubs have reported using these refined models to anticipate fatigue patterns in congested schedules, particularly when early winter weather fronts arrive ahead of midweek European ties. Data indicates that teams adjusting training loads based on blended forecasts maintained steadier performance outputs across consecutive matches compared with prior years.
Conclusion
The practice of merging climate records with performance metrics continues to evolve as more granular datasets become available, and European match forecasts benefit from this layered approach through improved anticipation of environmental effects on player output. Continued collaboration between meteorological services, academic researchers and league statisticians supports ongoing refinement of these models for future seasons.