22 Jun 2026
Tracking Recovery Timelines After International Duty to Inform Midweek Fixture Wagers
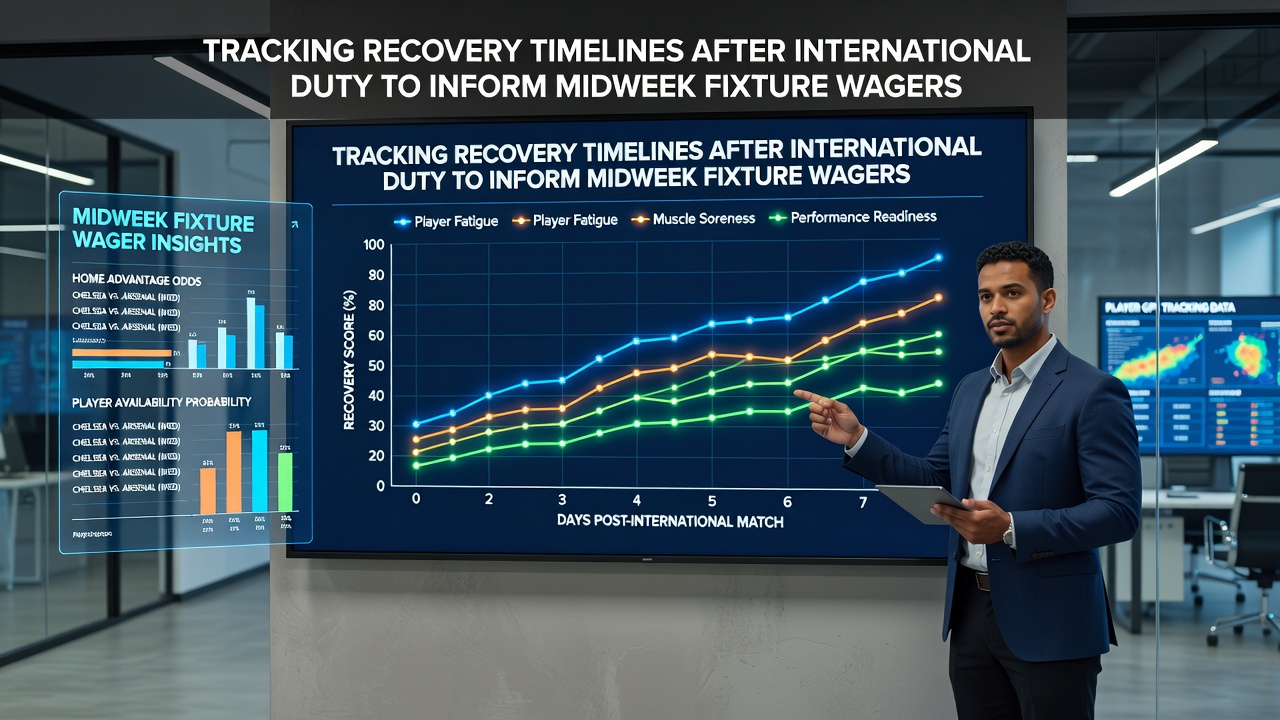
Recovery timelines after international duty have become a key data point for those analyzing midweek club fixtures, because national team commitments often leave players with limited rest before returning to domestic schedules. Observers note that international windows create distinct patterns in player availability and performance metrics, particularly when fixtures cluster in the middle of the week. Data from multiple European leagues shows measurable drops in distance covered and sprint intensity during the first club match following a break, which influences how markets price certain outcomes.
International Windows and Their Impact on Club Schedules
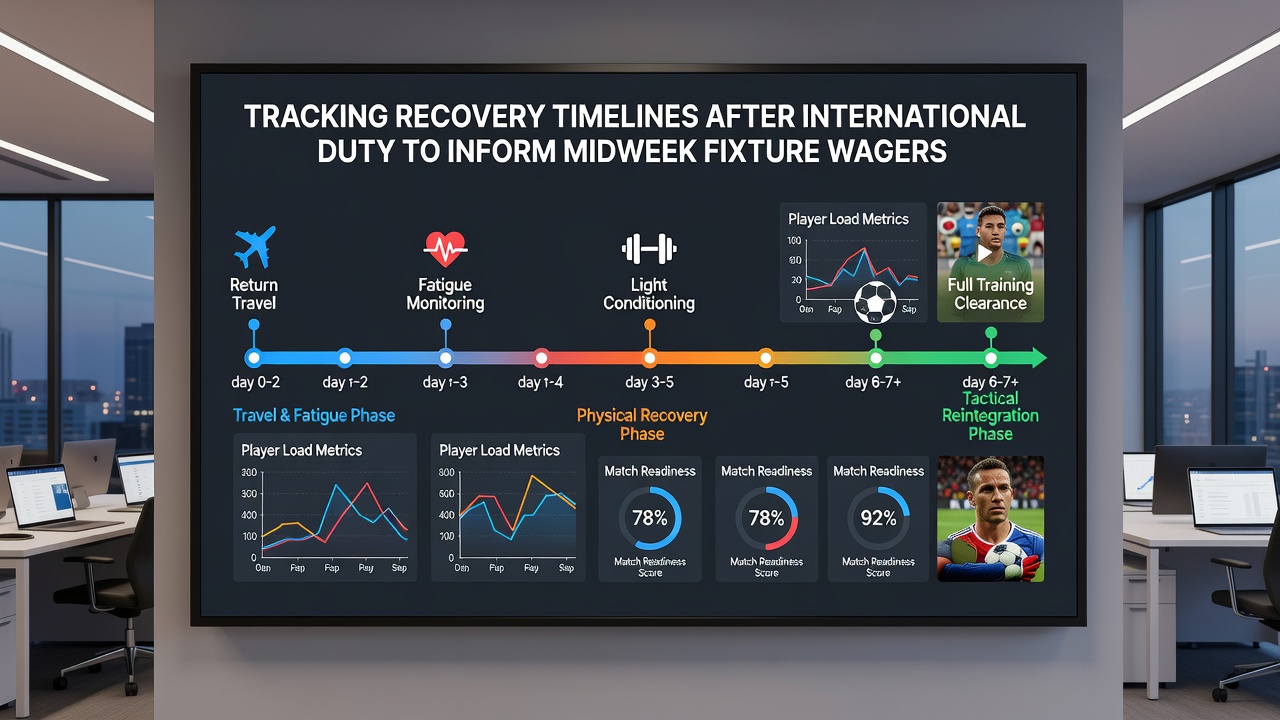
International breaks typically last between seven and fourteen days, with players traveling across time zones and competing in high-intensity matches before rejoining their clubs. Researchers from sports science programs have documented that full physiological recovery from such periods can require anywhere from three to ten days depending on travel distance, match minutes played, and individual fitness levels. When a midweek club game falls within that window, teams often field rotated squads or see reduced output from key personnel who featured prominently for their nations.
June 2026 stands out because FIFA has scheduled a major international window that overlaps with preparations for the expanded World Cup tournament. Clubs in major leagues face compressed schedules as players return from qualifiers or friendlies and immediately enter domestic or European competitions, creating betting markets where recovery data adds measurable context to team news and line-up announcements.
Key Factors That Shape Recovery Periods
Multiple variables determine how quickly athletes regain peak condition after national team duty. Age plays a consistent role, with data indicating that players over thirty often need an extra forty-eight hours compared with younger teammates. Position matters as well: central midfielders and full backs accumulate higher workloads during internationals than goalkeepers, leading to different return-to-form curves. Travel fatigue compounds these effects when squads cross continents, and studies tracking heart-rate variability show elevated stress markers that persist for several days post-flight.
Nutrition, sleep protocols, and club medical support further differentiate recovery speed across squads. Teams with advanced sports science departments publish anonymized workload reports that sometimes surface in public analysis, allowing observers to cross-reference minutes played internationally against subsequent club performances.
Data Sources Used to Build Recovery Models
Analysts combine official FIFA and UEFA match logs with GPS data from clubs that release aggregate statistics. A 2024 study published in the Journal of Sports Sciences examined over 1,200 player returns across five major leagues and found that 62 percent of participants recorded below-average expected goals contribution in their first club appearance after an international break. Such findings help frame probability adjustments when midweek fixtures approach.
Additional context comes from the Australian Institute of Sport, which has published comparative workload research on global tournament cycles. These datasets allow modelers to adjust for specific variables like continental travel and fixture density when projecting outcomes for Wednesday or Thursday matches.
Applying Recovery Timelines to Midweek Betting Markets
Bookmakers adjust odds on totals, player props, and team performance lines once line-ups and recent travel histories become available. When a star striker logs heavy minutes during an international window and faces a midweek club fixture three days later, markets often price lower goal expectations or reduced anytime goalscorer probability. Conversely, teams that rested key players during the break sometimes see inflated prices on their opponents because the rested side enters with fresher legs.
Live betting markets also reflect recovery signals once matches begin. Early indicators such as pass completion rates and high-intensity runs in the opening twenty minutes frequently align with pre-match models built around rest differentials. Bettors who track these metrics in real time can identify value when initial odds do not fully incorporate the fatigue factor.
Examples From Recent Seasons
One Premier League side recorded a 0.8 expected goals per game average in midweek fixtures immediately following international breaks over a two-year span, compared with 1.4 in other midweek slots. A separate Bundesliga club showed similar patterns, with win rates dropping 18 percentage points when three or more starters returned from duty within seventy-two hours. These case studies illustrate how recovery timelines translate into measurable betting edges when aggregated across multiple seasons.
European competitions add another layer because travel distances vary widely. UEFA Champions League midweek matches that follow South American qualifiers have produced distinct statistical profiles, with analysts noting higher draw percentages in those specific windows.
Conclusion
Recovery timelines after international duty provide a structured framework for evaluating midweek club fixtures across betting markets. By combining travel data, workload statistics, and historical performance trends, analysts construct models that account for the physical demands placed on players during national team windows. As schedules intensify ahead of the June 2026 international period, these timelines continue to supply objective inputs that inform wager construction without relying on subjective assessments of form or motivation.