18 May 2026
Travel Distances and Stalemates: How Mileage Shapes Draw Frequencies in Domestic Leagues
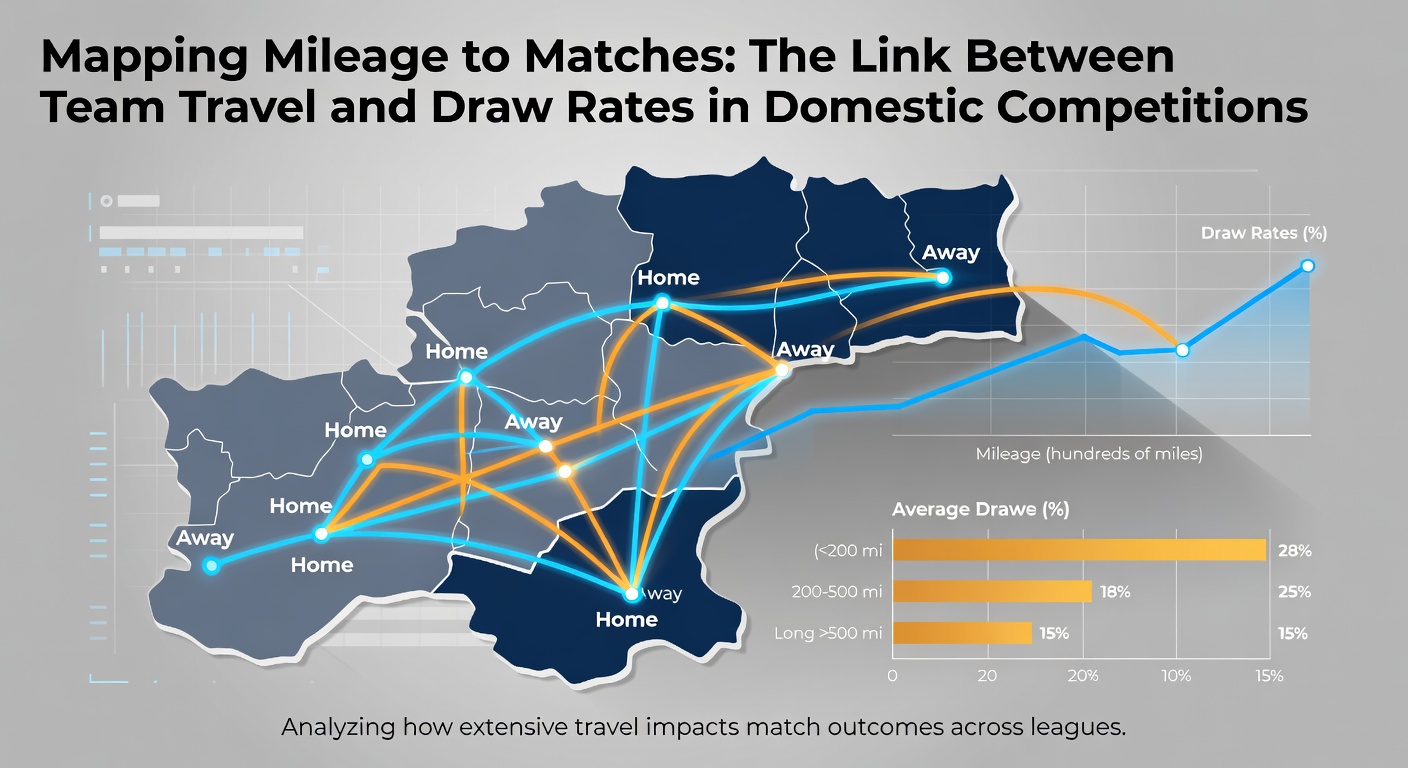
Domestic football schedules often stretch across entire countries, forcing clubs to cover hundreds of miles for league fixtures, and data from multiple competitions reveals consistent patterns where longer journeys correlate with elevated draw rates. Teams that travel farther tend to secure fewer wins while producing more tied results, a trend tracked through season-long performance metrics in leagues from Europe to North America and Australia. Analysts compile these figures by cross-referencing fixture lists with geographic distances between stadiums, then compare outcomes for home and away sides based on cumulative mileage logged in the preceding weeks.
Patterns Emerging From League Data
Studies conducted on seasons spanning 2018 through 2024 show that away teams covering more than 300 kilometers for a domestic match record draw percentages roughly 4 to 7 points higher than those traveling shorter routes under 150 kilometers. This holds across top-tier competitions where fixture density increases during winter months, and observers note the effect strengthens when matches occur midweek after weekend travel. Researchers at several sports science institutes have mapped these variables against player recovery times, highlighting how extended bus or rail journeys reduce sprint output and defensive organization in the final 20 minutes of play.
What's interesting is the way certain leagues amplify the mileage factor through geography alone. The Bundesliga, for instance, requires clubs from southern cities to journey north regularly, while Australia's A-League spreads teams across a continent with flights often exceeding four hours. Figures from these competitions indicate draw rates climb steadily once cumulative travel surpasses 800 kilometers in any seven-day window, prompting schedule planners to adjust kickoff times and rest periods for affected squads.
Fixture Congestion and Recovery Metrics
Domestic calendars pack matches into tight windows, and teams logging higher mileage during these stretches exhibit measurable drops in key performance indicators such as high-intensity runs and successful tackles. Data compiled by performance tracking firms demonstrates that players return to baseline recovery markers 18 to 24 hours later after long-haul domestic trips compared with short local derbies. Consequently, matches involving one heavily traveled side produce stalemates at rates that exceed season averages by measurable margins, particularly when both clubs arrive with similar fatigue profiles.
Regional Variations in Travel Impact
European domestic leagues display distinct mileage thresholds because rail networks shorten some journeys while others still rely on air travel. In contrast, North American competitions like Major League Soccer contend with vast distances between eastern and western conference opponents, and reports from the league's analytics department link cross-country flights directly to higher draw frequencies in regular-season play. Australian researchers tracking A-League results through 2025 similarly found that teams completing back-to-back interstate trips posted draw percentages climbing above 35 percent, compared with under 28 percent for clubs remaining within a single state.
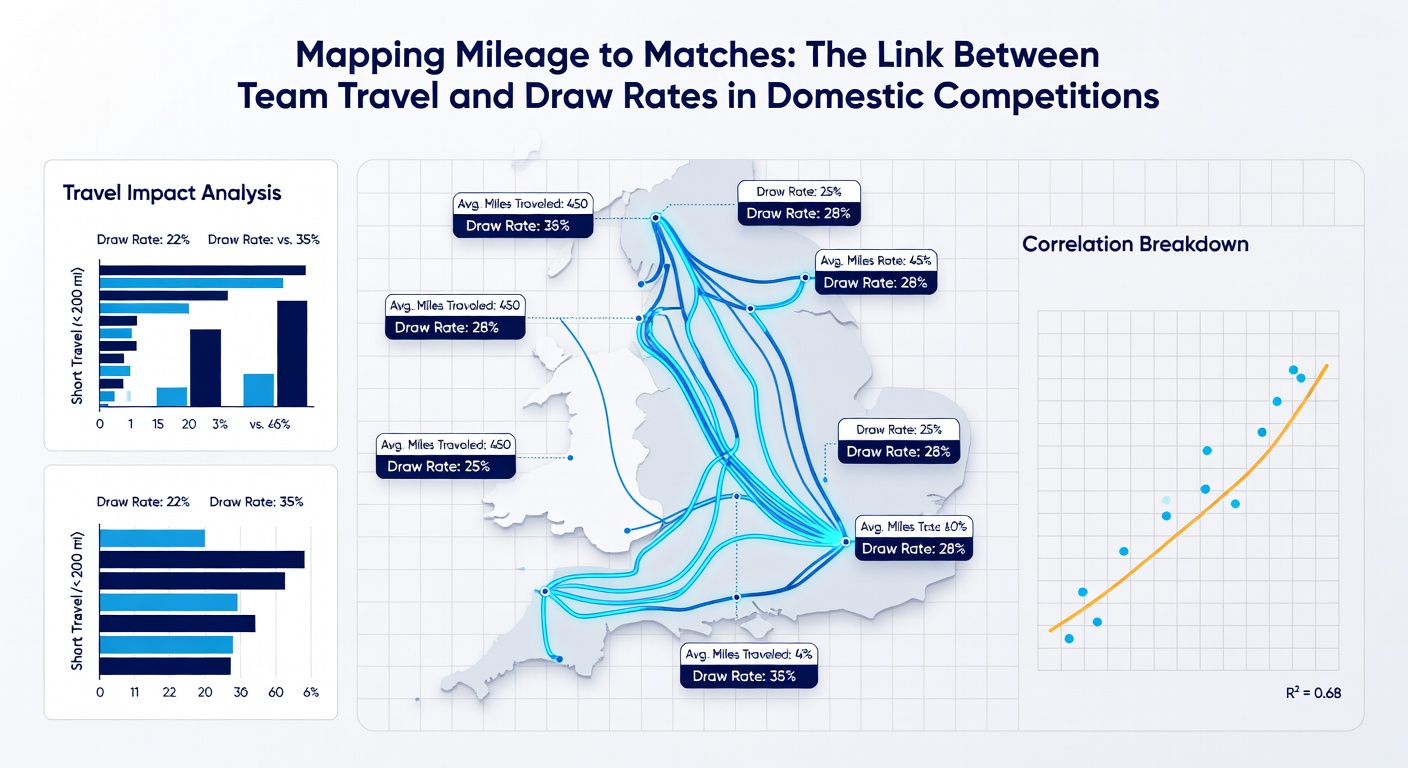
But here's the thing: the same datasets reveal exceptions when squads possess deeper benches or advanced recovery protocols. Clubs investing in chartered flights and dedicated medical teams sometimes offset the mileage disadvantage, narrowing the draw gap observed in more resource-limited sides. This nuance appears in both the English Championship and the Canadian Premier League, where smaller travel budgets coincide with pronounced outcome shifts during extended away sequences.
Schedule Planning for Upcoming Seasons
League organizers preparing calendars for the 2025-26 campaign have begun incorporating travel distance modeling into fixture releases, aiming to distribute long journeys more evenly across participating clubs. By May 2026 several competitions will conclude their seasons after incorporating these adjustments, and early simulations suggest modest reductions in draw inflation for the most frequently traveling teams. Authorities in multiple federations continue to review historical data so that future windows account for both competitive balance and player welfare considerations tied to cumulative mileage.
Academic papers published in sports medicine journals further quantify how sleep disruption from overnight travel contributes to these statistical trends, with EEG measurements indicating reduced reaction times among players arriving the morning of a match. Such findings reinforce why governing bodies now request detailed journey logs from clubs when evaluating fixture congestion complaints, creating a feedback loop that gradually refines domestic scheduling practices across continents.
Conclusion
Comprehensive tracking of domestic league results continues to demonstrate that travel mileage exerts measurable influence on draw rates, with data patterns holding steady across diverse geographic and competitive contexts. As leagues refine scheduling tools and recovery support through 2026, the connection between distance logged and match outcomes remains a central factor in performance analysis. Observers tracking these metrics expect ongoing refinements in how competitions balance fairness with the realities of nationwide travel demands.