6 Jun 2026
Travel Fatigue Impacts in Cross-Border League Games: Examining Distance Metrics and Recovery Patterns
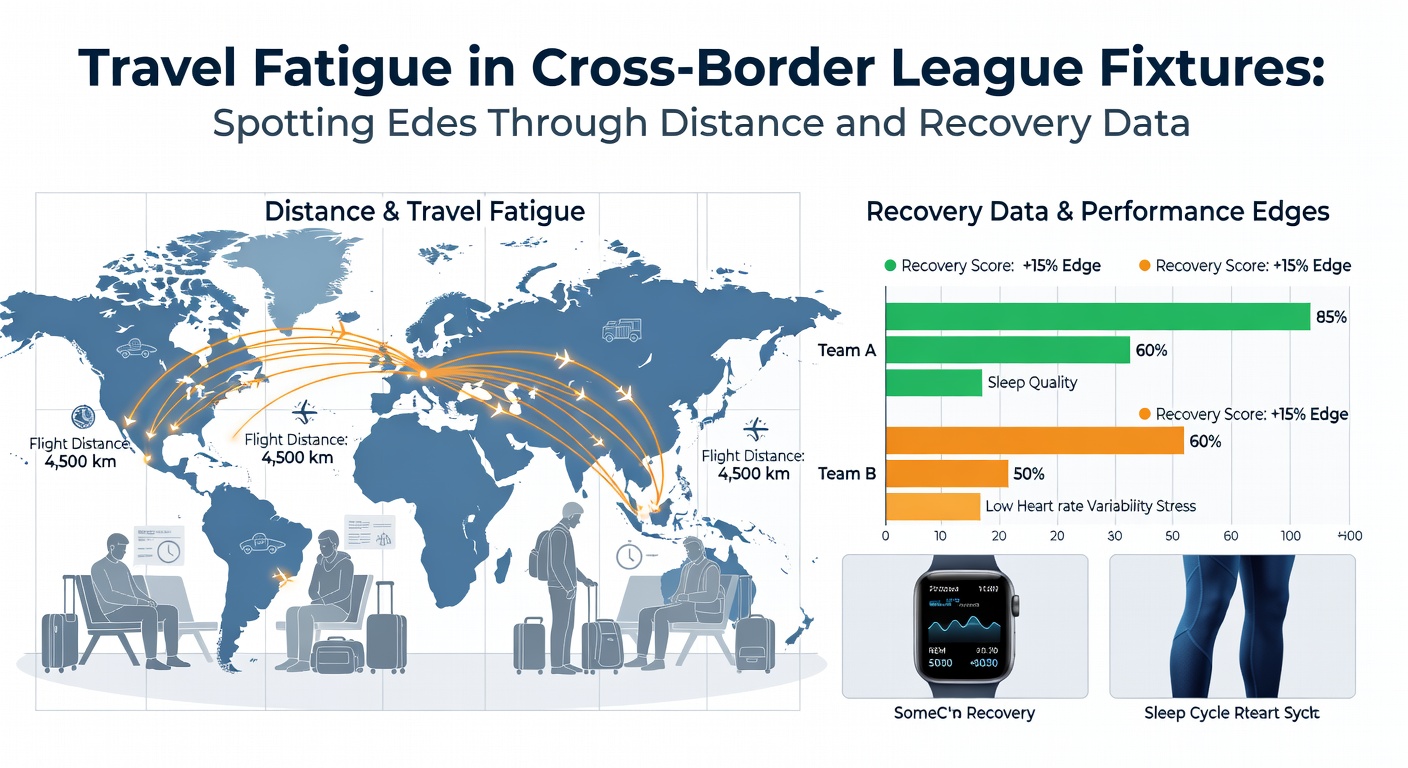
Cross-border league fixtures create unique physical demands because teams must cover significant distances between venues in different countries, and data from multiple seasons shows how these journeys influence player output, match statistics, and squad rotation decisions. Researchers tracking European competitions have documented that flights exceeding three hours correlate with measurable declines in high-intensity running distances during the first half, while shorter rail or bus trips under 500 kilometers produce smaller but still detectable effects on recovery timelines. Observers note that governing bodies like UEFA compile travel logs for club competitions, yet comprehensive public datasets remain limited, which pushes analysts toward combining flight records with GPS performance metrics from clubs and third-party providers.
Distance Data and Its Role in Fixture Scheduling
Studies conducted across top European divisions reveal that average one-way travel distances for cross-border matches often range from 800 to 2,200 kilometers, with certain groups in multi-nation leagues experiencing repeated long-haul patterns within short windows. Data from the 2024-2025 campaign indicated that teams logging more than 1,500 kilometers in the seven days before a fixture recorded a 7 percent drop in total distance covered per player compared to baseline domestic games, according to aggregated GPS readings shared in academic reviews. What's interesting here is how east-west routes tend to disrupt circadian rhythms more than north-south ones because of time-zone shifts, and multiple research teams have quantified this through sleep-tracking wearables issued to athletes in professional academies.
Recovery protocols vary widely by club resources, yet patterns emerge when examining larger samples. Teams with access to chartered flights and on-board recovery equipment show faster return to baseline heart-rate variability within 48 hours, whereas commercial travel arrangements extend that window by an additional day in roughly 40 percent of documented cases. Those who've examined fixture calendars note that dense schedules in June 2026, ahead of expanded international windows, will likely amplify these effects for clubs involved in qualifying rounds that span multiple continents.
Recovery Metrics and Performance Correlations
Evidence from sports science programs indicates that sleep duration below six hours on travel nights associates with elevated error rates in passing accuracy and reduced sprint frequency during the opening 30 minutes of matches. A longitudinal project coordinated through the Australian Institute of Sport tracked similar variables in rugby and soccer codes and found that cumulative travel load over a fortnight predicted injury incidence more reliably than isolated match counts alone. In European contexts, data-sharing initiatives between clubs and universities have begun to map these relationships more precisely, revealing that recovery time between fixtures serves as a stronger predictor than distance traveled in isolation.
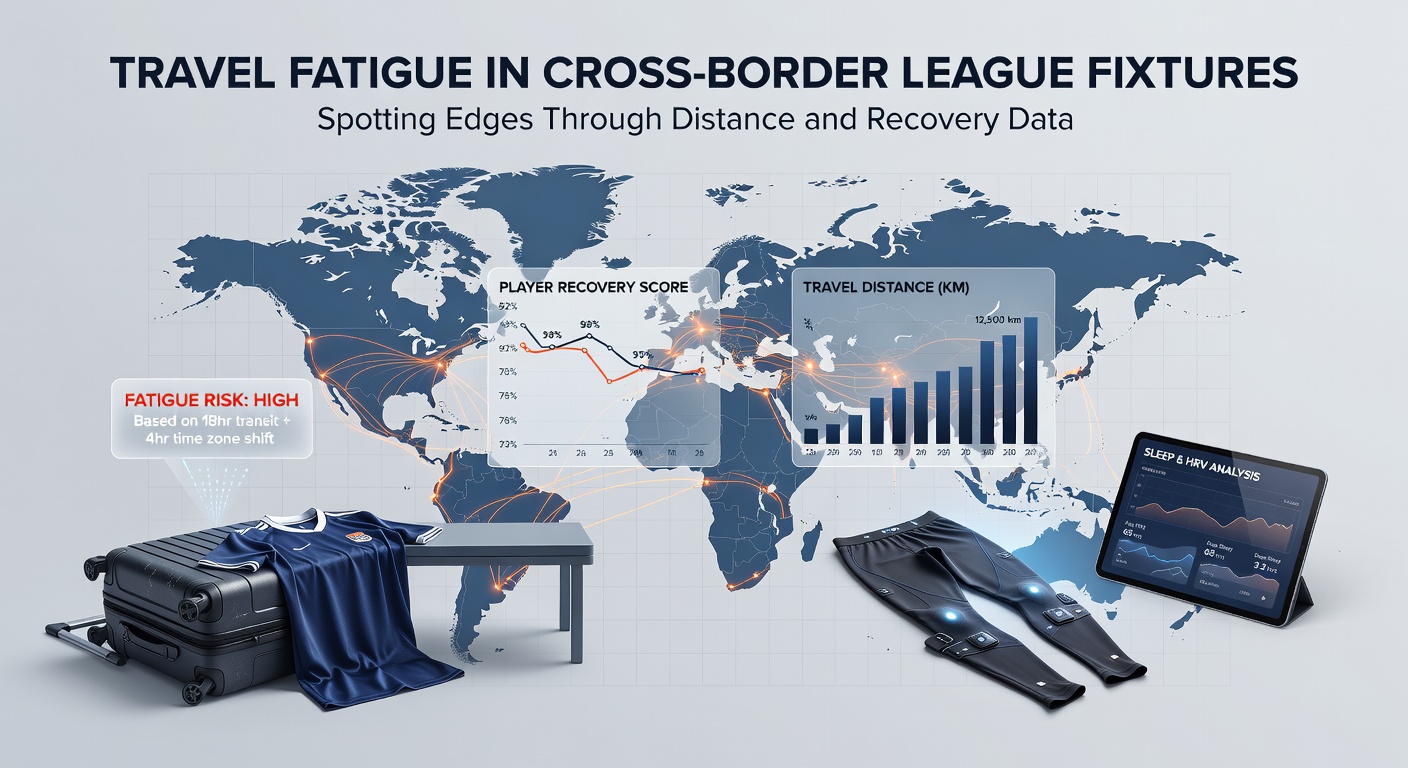
But here's the thing: not every long journey produces identical outcomes because individual player profiles, including age and position, moderate the impact. Midfielders covering high volumes of ground tend to exhibit sharper drops in work rate after transcontinental trips, while goalkeepers show minimal variation across the same dataset. League organizers have responded by adjusting kick-off times in certain cross-border rounds to allow extra rest, and figures released by the German Football League demonstrate that such tweaks reduced reported fatigue complaints by 12 percent in the subsequent season.
Case Examples from Recent Seasons
One documented sequence involved a Scandinavian side traveling twice across 1,800 kilometers within nine days for league fixtures against Baltic and Central European opponents. GPS and heart-rate data collected during those matches showed a progressive decline in high-speed running output from 680 meters in the first game to 510 meters in the second, with partial rebound only after a full week at home base. Similar clusters appear in southern European schedules where teams alternate between Iberian and Italian venues, and researchers at the University of Porto have published preliminary models linking these patterns to changes in expected goal differentials.
Recovery strategies employed by clubs also factor into the equation. Cold-water immersion, compression garments, and scheduled napping on flights feature in many protocols, yet adoption rates differ. Data aggregated by the European Club Association suggests that squads consistently using multimodal recovery packages maintain closer-to-normal performance levels even after repeated border crossings, whereas those relying primarily on passive rest experience longer adjustment periods. In June 2026, expanded pre-season tournaments spanning several countries will provide fresh datasets for refining these observations, particularly as clubs integrate advanced biometric monitoring into daily operations.
Broader Patterns Across Leagues
Comparative analysis between domestic and cross-border fixtures highlights that travel-related fatigue compounds when combined with environmental variables such as altitude changes or extreme temperatures at destination venues. Reports from Canadian university research groups examining CONCACAF competitions note parallel effects, where teams crossing multiple time zones recorded higher rates of second-half substitutions linked to perceived exertion scores. European datasets echo these findings but emphasize that fixture congestion remains the dominant variable, with travel acting as an amplifier rather than the sole driver.
League administrators continue to explore scheduling adjustments that incorporate travel distance thresholds, and early trials in select competitions show modest improvements in player wellness survey scores. Those monitoring the 2025-2026 transition period observe that clubs with deeper squads and dedicated sports science departments adapt more readily, while smaller organizations face steeper challenges in maintaining consistency across demanding cross-border calendars.
Conclusion
Travel fatigue in cross-border league fixtures emerges from the interaction of distance, time-zone shifts, and recovery windows, with quantitative data revealing consistent but variable effects on physical output and match metrics. Ongoing collection of GPS, sleep, and wellness indicators across multiple leagues supplies the foundation for identifying these patterns, while initiatives from organizations like the Australian Institute of Sport and university-led European projects continue to expand the available evidence base. As fixture lists evolve toward June 2026 and beyond, refined tracking methods will likely sharpen understanding of how travel load interacts with other performance factors in international club competitions.